A pilot would never fly blind. Every moment in the cockpit is guided by instruments that reveal the aircraft’s speed, altitude, and overall condition. Without that constant stream of information, safely navigating the skies would be impossible.
Modern IT systems work the same way. To understand what’s happening inside complex environments, IT teams rely on telemetry data generated by servers, applications, containers, and cloud services.
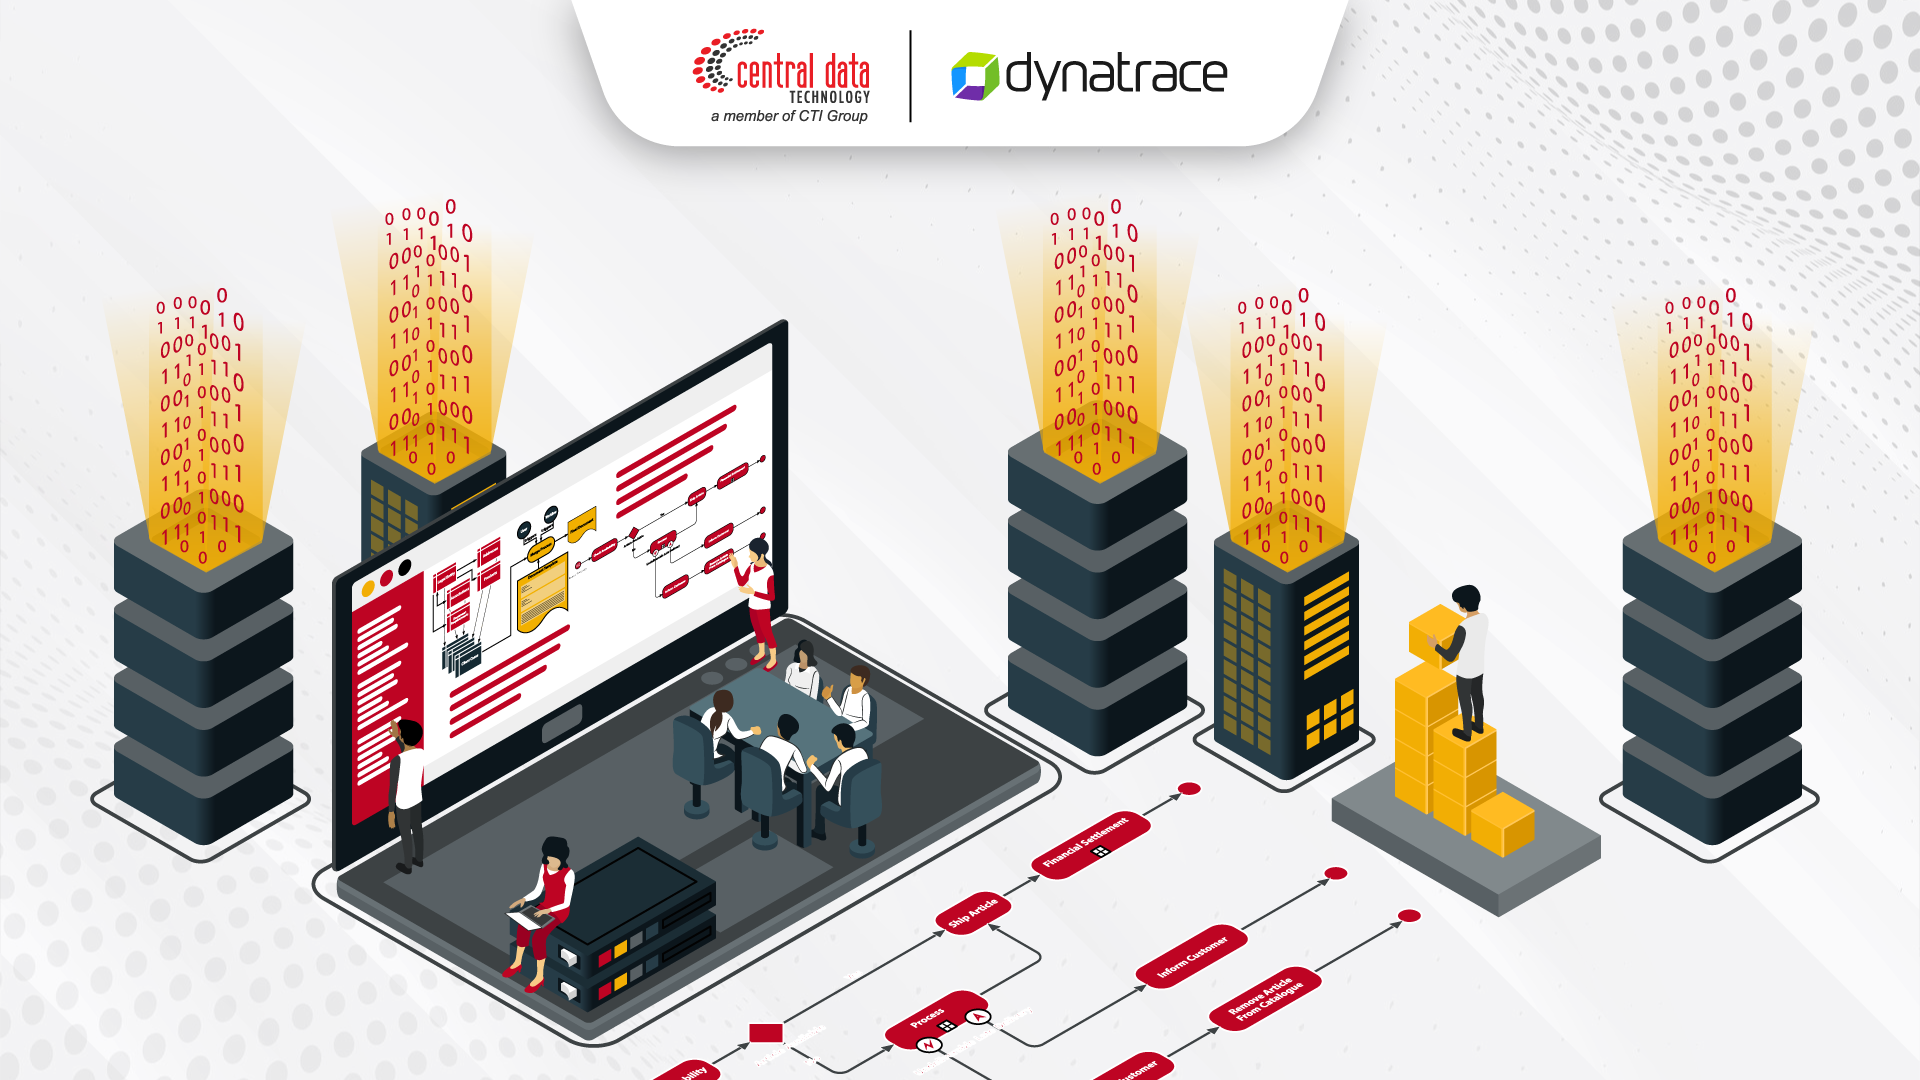
The challenge is that as enterprise infrastructure becomes more distributed and dynamic, the volume of telemetry data grows rapidly. Without the right observability tools, these streams of information can quickly turn into overwhelming noise rather than meaningful insight.
In this article, we’ll explore how telemetry data works, the challenges organizations face when managing it, and the solutions that help IT teams gain clearer visibility across modern IT environments.
What Is Telemetry Data?
Telemetry data refers to operational signals automatically generated by applications, servers, and infrastructure components that reflect the health and activity of a system in real time. These signals typically appear in the form of logs, metrics, and traces, helping IT teams understand application performance, service interactions, and potential issues across distributed systems.
Three Types of Telemetry Data IT Teams Should Monitor
To fully understand system behavior, IT teams rarely rely on a single type of telemetry signal. Instead, different forms of telemetry data are analyzed together to create a clearer picture of what’s happening across the system.
Here are three of the most common types of telemetry data used to monitor system health.
Logs
Logs record events that occur within a system or application. Each entry typically includes a timestamp and information such as errors, system activities, or application processes. In many cases, logs serve as the first clue when IT teams begin investigating an incident.
Metrics
Metrics are numerical measurements that represent system performance at a specific point in time. Examples include CPU usage, memory consumption, response times, and request volume. By analyzing metrics, IT teams can continuously monitor performance and identify trends or anomalies.
Traces
Traces follow the path of a request as it moves through different services within an application. This type of telemetry helps IT teams understand service dependencies and pinpoint where latency or bottlenecks occur, especially in microservices architectures.
Challenges of Managing Telemetry Data in Modern IT Systems
Modern IT environments consist of interconnected technologies such as cloud infrastructure, microservices, containers, and APIs. Each of these components continuously generates telemetry data, often in massive volumes. Without the right observability strategy, making sense of this data can become extremely difficult.
Here are some of the most common challenges organizations face when managing telemetry data.
High Data Volumes
Cloud-native and distributed systems generate telemetry data at enormous scale. IT teams often need to sift through thousands or even millions of logs, metrics, and traces to identify meaningful insights.
Fragmented Monitoring Tools
In many organizations, logs, metrics, and traces are collected using different monitoring tools. This fragmentation slows down incident analysis because teams must switch between multiple platforms to build a complete picture of what happened.
Difficult Root Cause Identification
When incidents occur, operations teams frequently need to manually correlate telemetry data from multiple sources to determine the root cause. In complex systems, this process can take significant time and effort.
Read More: Security Observability: The Key to Proactive Defense in the Digital Era
Dynatrace Davis AI: Automated Telemetry Data Analysis
As telemetry data continues to grow in both volume and complexity, IT teams often struggle to quickly understand what is actually happening inside their systems. Davis AI within the Dynatrace Platform addresses this challenge by automatically analyzing telemetry data through an AI-powered observability approach.
Dynatrace brings logs, metrics, and traces together into a unified system context, making relationships between applications, infrastructure, and services immediately visible. This approach reduces alert noise, accelerates anomaly detection, and simplifies root cause analysis.
With real-time analytics at enterprise scale, IT teams gain full-stack visibility across their environments and can take faster action to maintain system performance and service reliability.
Build Modern Observability with CDT
Central Data Technology (CDT), part of the CTI Group, helps enterprises implement modern observability practices to manage telemetry data across increasingly complex IT environments. With the Dynatrace Platform, organizations can gain deeper visibility into the health of their systems, applications, and infrastructure.
Through an integrated approach, CDT enables companies to leverage telemetry data more effectively to monitor performance, accelerate issue detection, and maintain service stability across modern IT environments.
Explore the right observability solution with our team and gain clear visibility into your systems.
Author: Danurdhara Suluh Prasasta
CTI Group Content Writer