Traditional monitoring often struggles to identify the root causes of issues in enterprise architectures that rely on thousands of Kubernetes pods and multi-cloud environments. Performance data scattered across different tools makes it difficult for IT teams to connect infrastructure disruptions with application issues. As a result, incident investigations can take longer, increasing the risk of service-level agreement (SLA) violations.
Full stack observability enterprise offers a relevant approach to addressing this complexity. But what makes traditional monitoring less effective in distributed environments, and how can enterprises maintain application performance while meeting business SLAs?
Traditional Monitoring Is Reaching Its Limits
Traditional monitoring typically helps IT teams assess the condition of specific components, such as CPU utilization, memory capacity, or server status. However, knowing that a component is experiencing an anomaly does not always explain why user transactions are slowing down or business services are disrupted. This challenge becomes more pronounced when applications consist of multiple microservices running in cloud environments and dynamic containers.
Data Silos Lead to Longer Investigations
When infrastructure metrics, application logs, and network performance data reside in separate dashboards, IT teams must gather information from multiple sources before understanding what is actually happening. This creates monitoring silos and increases the investigative workload, especially when several components show signs of disruption at the same time.
Without sufficient data correlation, teams may spend valuable time examining symptoms one by one, even though the root cause may originate from a single service or dependency.
High MTTR Puts SLAs at Risk
Mean Time to Resolve (MTTR) refers to the average time required to resolve an incident. The longer the investigation and recovery process takes, the greater the potential impact on transactions, operational productivity, and customer experience. For services that depend on application availability, delayed incident resolution can increase the risk of failing to meet SLAs.
Three Pillars of Full Stack Observability Enterprise
Full stack observability goes beyond collecting performance data. It connects telemetry from applications, infrastructure, and user experience to help IT teams understand how each component affects overall service delivery. For enterprises, this unified visibility provides a foundation for managing system complexity and making more informed operational decisions.
1. APM and Distributed Tracing
Application Performance Monitoring (APM) helps teams monitor application performance, identify bottlenecks, and assess service health. When combined with distributed tracing, teams can follow transactions from user requests and API calls through backend processing and database operations. This makes it easier to pinpoint where processing delays occur and identify the factors contributing to degraded application performance.
2. Real User Monitoring
An application that appears to perform normally from an infrastructure perspective does not necessarily guarantee an optimal user experience. Users may still encounter slow-loading pages, delayed interactions, or transactions that fail to complete as expected. Real User Monitoring (RUM) helps enterprises monitor performance based on actual user interactions and correlate those insights with system conditions. This enables teams to identify bottlenecks affecting digital experiences, including those in digital banking applications and e-commerce platforms.
3. Unified Visibility into Kubernetes
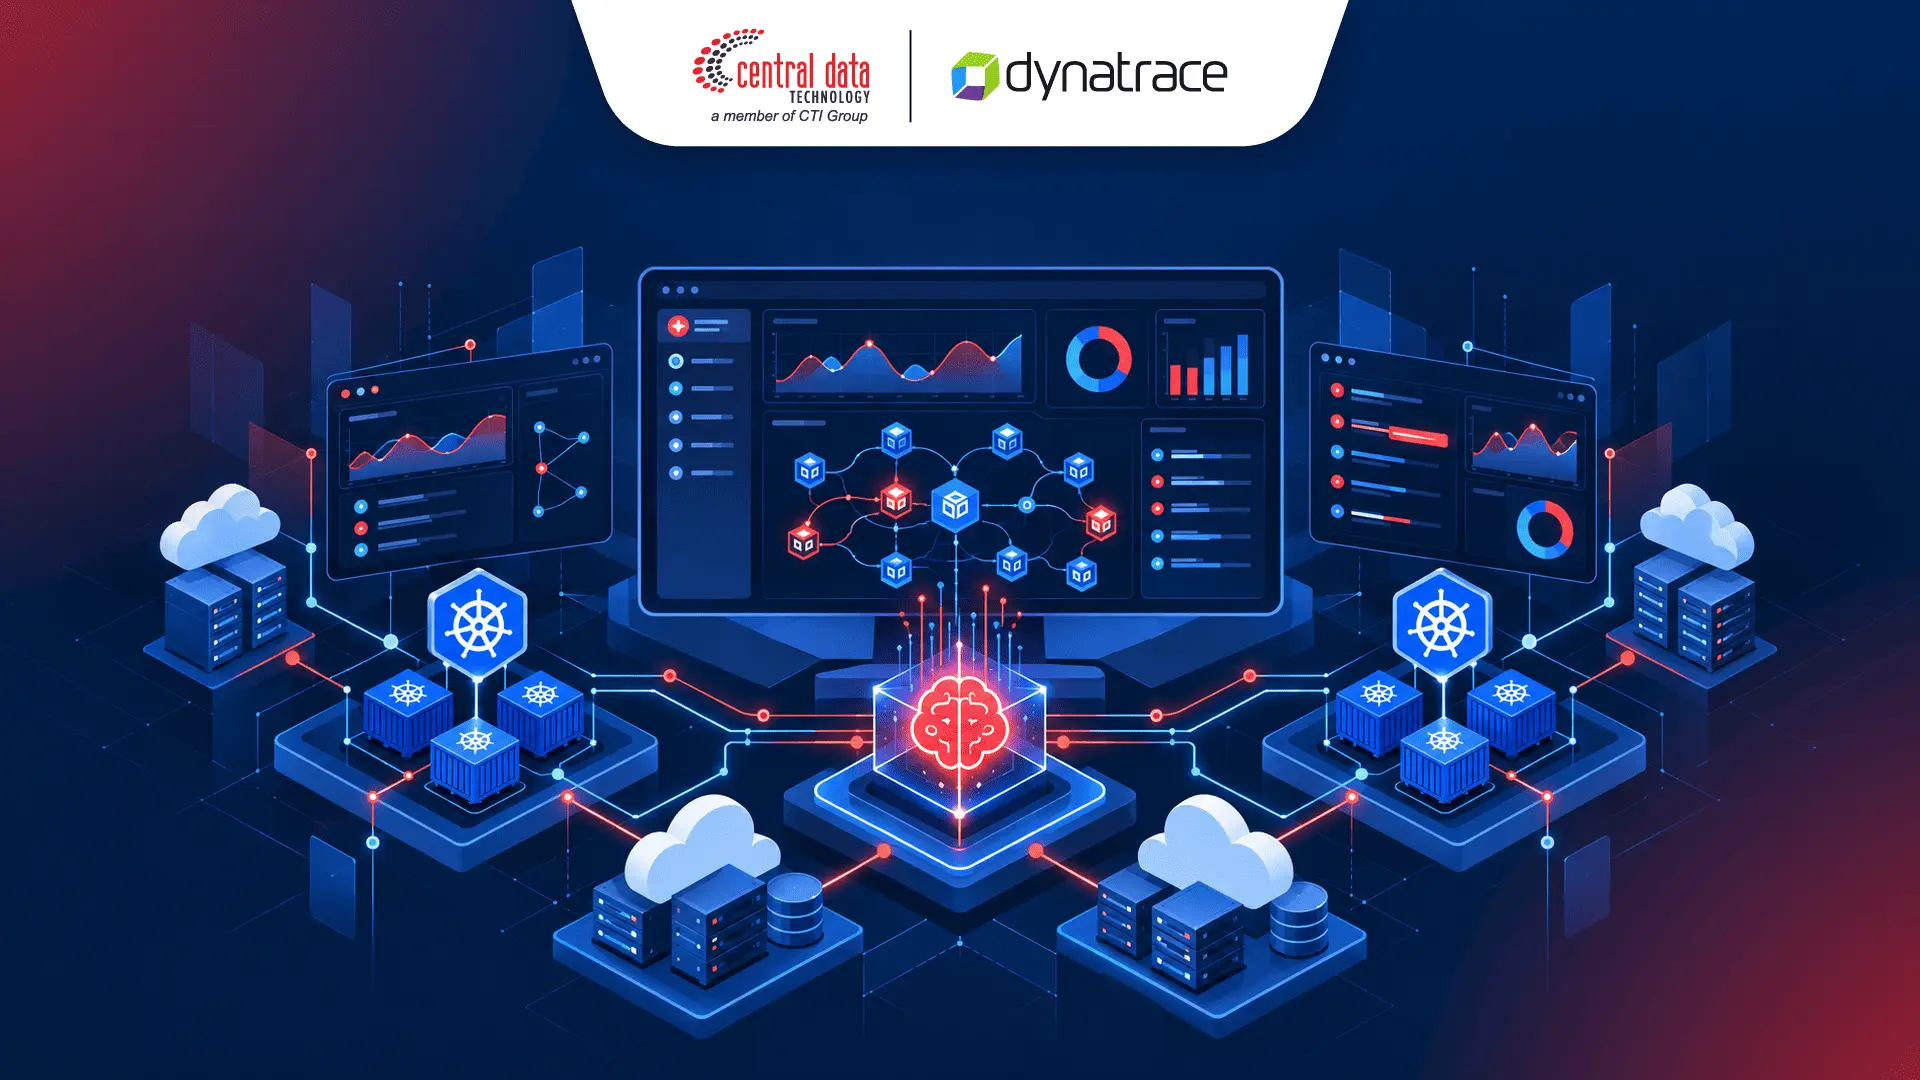
Kubernetes-based architectures allow applications to scale dynamically through containers and workloads that adapt to changing demands. However, component changes during deployments and capacity adjustments also make monitoring more complex. Full stack observability helps teams monitor cluster, container, workload, and application health through automated component discovery and dependency mapping. This maintains visibility across constantly evolving cloud-native environments without relying on manual maps that can quickly become outdated.
Dynatrace, AI-Powered Root Cause Analysis for Faster Resolution
When disruptions occur, the biggest challenge is often not detecting an anomaly but understanding its cause amid numerous components and notifications. Complex systems can generate multiple alerts within a short period, making it difficult for teams to distinguish secondary symptoms from issues that require immediate attention.
Dynatrace supports incident investigations through data correlation, dependency mapping, and AI capabilities that help identify potential root causes. This approach enables teams to move away from fragmented manual checks toward analysis that considers relationships between components and the impact of disruptions on services.
OneAgent and Smartscape, Automated Dependency Mapping
Dynatrace OneAgent collects observability data from supported technology components, while Smartscape maps the technology topology to illustrate relationships between applications, services, and infrastructure. Together, they help teams understand how components are interconnected and how disruptions in one area can affect others.
With automated dependency mapping, enterprises can also reduce their reliance on manual documentation that requires continuous updates. This helps keep information about system topology and service relationships relevant, accelerating incident investigations in constantly evolving enterprise environments.
]Davis AI, From Alerts to Root Causes
Davis AI helps analyze observability data to identify anomalies, investigate potential causes, and provide context for disruptions. Rather than treating every alert as an isolated issue, this approach helps teams understand the relationships between symptoms and changes in system conditions.
For SRE, DevOps, and IT operations teams, these capabilities can help prioritize investigations and reduce repetitive manual work. Results depend on the environment, configuration, and characteristics of each incident. However, more targeted analysis can support efforts to reduce MTTR and maintain service reliability.
Observability vs. Traditional Monitoring
Aspect | Traditional Monitoring | Dynatrace Full Stack Observability |
Issue detection | Relies on metrics and configured thresholds | Combines telemetry with AI-powered anomaly analysis |
Dependency mapping | May require manual documentation and updates | Supports automated discovery and topology mapping |
Transaction visibility | Information may be scattered across multiple tools | Supports cross-service transaction tracing through distributed tracing |
Root cause analysis | Requires manual correlation and investigation | Helps identify potential root causes with cross-component context |
Incident management | Teams must consolidate information from multiple sources | Helps centralize information to support investigations and prioritization |
The key difference between traditional monitoring and full stack observability lies in the depth of context available for understanding issues. Monitoring helps indicate the condition of individual components, while observability connects multiple signals to help explain the causes of disruptions and their impact on services.
Implementing Observability Without Disrupting Operations
Implementing full stack observability should begin with identifying the most critical business needs and operational risks. Enterprises can prioritize essential transaction flows, services with numerous dependencies, or applications with strict SLA targets.
Next, integrate metrics, logs, and traces so they can be analyzed within a connected context. Standards such as OpenTelemetry support telemetry integration, while dependency mapping helps teams understand relationships between components. Dashboards should also be tailored to the needs of developers, SRE teams, infrastructure managers, and business leadership.
To maximize its impact, connect monitoring insights with business indicators such as transaction success rates, application responsiveness, service availability, and SLA compliance. With a shared data context, application, infrastructure, and IT operations teams can prioritize incidents based on their impact, investigate disruptions, and plan improvements in a more coordinated way.
FAQ: Full Stack Observability Enterprise
What is the difference between traditional monitoring and full stack observability?
Traditional monitoring focuses on the condition of individual components and specific performance indicators. Full stack observability connects metrics, logs, traces, and dependency information to help teams understand the causes of disruptions and their impact on services more comprehensively.
How does Dynatrace help reduce MTTR?
Dynatrace combines observability data, dependency mapping, and AI capabilities to help detect anomalies and identify potential root causes. These insights can narrow the scope of investigations and help teams determine which actions to prioritize.
Does full stack observability support Kubernetes?
Yes. Dynatrace provides monitoring capabilities for Kubernetes and cloud-native environments, including visibility into clusters, workloads, containers, applications, and their dependencies. Available coverage depends on the components and configurations implemented.
Does implementing Dynatrace require application code changes?
Dynatrace OneAgent supports automated instrumentation and data collection for various compatible technologies, reducing the need for manual code changes. However, additional configuration requirements depend on the technology, architecture, and desired monitoring scope.
Build Comprehensive Enterprise Application Visibility with CDT
As application architectures become increasingly complex, enterprises need more than monitoring alone to maintain system performance and reliability. Comprehensive visibility helps IT teams understand the relationships between applications and infrastructure, identify root causes, and address disruptions that could affect business operations.
Through Dynatrace Full-Stack Observability, Central Data Technology (CDT), part of CTI Group, helps enterprises improve application and infrastructure visibility through unified monitoring and AI-powered analytics. This approach supports more targeted incident investigations and helps enterprises maintain service performance and meet SLA targets.
Contact the CDT team to discover how Dynatrace's full stack observability enterprise solution can support your organization's IT infrastructure needs and complexity.
Author: Angela Merici Retna Perwitasari
Content Writer Intern CTI Group